MA200: Growth Indicators Analysis
Our powerful MA200 report displays KPI metrics for each employee, including productivity, service and retail sales, average ticket, rebooking, retention, and more.
Tip: Run the MA200 report monthly to analyze the performance of your business and your employees.
What is a "visit" in this report?
This report follows our usual standard for what constitutes a visit: a visit occurs when a client is rung up for at least one service on a transaction. It is not necessary for the service to have been booked before it was rung up.
How is client retention determined?
Meevo looks into the past for clients in a "pool month," and then looks ahead to see if those clients had a return visit during the number of months defined in report setup. In this way, retention in the MA200 is always relative to your selected date range.
Note: Transient clients and Anonymous clients are never included in retention or rebooking calculations.
Here's how it works:
- Retention in the MA200 always looks back 4 months from any month included in the date range. The month being analyzed is known as the "pool month" because it is looking for a pool of clients who visited the business during that month.
- Then, the report looks x months forward from the pool month based on the Months to look for a return visit field that you picked during report setup. Meevo analyzes those months to see if any "pool" clients had a return visit to the business during that time frame. If so, those clients were retained.
- If the date range you selected during report setup includes more than one month, the report will repeat steps 1 and 2 above for each month in the range. In that case, the MA200 retention section will display the combined totals and retention for each individual month.
| If you run the report in... | Client pool will be pulled from... | To see if they came back for a visit during...* |
| January | September | October, November, December |
| February | October | November, December, January |
| March | November | December, January, February |
| April | December | January, February, March |
| May | January | February, March, April |
| June | February | March, April, May |
| July | March | April, May, June |
| August | April | May, June, July |
| September | May | June, July, August |
| October | June | July, August, September |
| November | July | August, September, October |
| December | August | September, October, November |
* These months correspond with the Months to look for a return visit setting in the report setup screen. For example, if you run the report in January and Months to look for a return visit is set to 1, then Meevo will look only at October for a return visit, as that is one month beyond the pool month of September.
How is employee productivity handled in this report?
- Productivity is based on actuals unless clock-ins were not required on the Work Activity, in which case it's based on scheduled hours.
- If Include in productivity calculations is not enabled on an employee's profile:
- They are not considered in the productivity calculation on the Summary Page (if it’s displayed). A note instructs you to check each employee’s Detail Page to see who was and was not included.
- They are considered in the productivity calculations on the Employee Pages regardless of whether or not the Include in productivity calculations is enabled. Each employee who was not considered in the Summary Page productivity calculation will have the following note appear on their employee Detail Page: Include in Overall Productivity Calculations not selected. Not included in summary page productivity calculation.
- A service add-on that does not add time to an appointment will still count as a service performed, but it will not add any time to productive calculations.
How are "rebooks" determined in this report?
For details on how Meevo determines which appointments are rebooks, see Details on Rebooks in Meevo. The Examples section walks you through a typical rebook.
More details on the MA200
- All service sale metrics account for Swap Upgrade Fees unless otherwise specified. Cancellation and no-show fees are not included in any service sale metrics.
- For the Retention section to appear, this report must be run for a date range greater than or equal to 28 days.
- "Retention" clients are not relevant to sales sections; they are completely separate metrics. Sales data is for the selected date range, and Retention data applies to the 4 months prior to any month in the range.
- The "Unique clients" fields in the report refer to unique client profiles (client IDs). Anonymous Clients are not considered.
Report definitions
Hours and Productivity sectionHours and Productivity section
- Weeks Analyzed: The number of weeks within the date range. (Number of days in the report date range / 7)
- Hours Productive: The total number of hours where the employee was productive: that is, they performed a service (the service was performed and checked out; no-shows and cancellations do not count as productive) or had a productive block. Service timings are based on the Calculate Productive Time Based On setting in report setup. Only Block Types classified as Productive Block Time count towards Hours Productive. Note refunds do not affect this metric.
- Hours Incl. in Productivity: The total number of hours that the employee could have been productive, such as a Work Activity that has Include in productivity calculations enabled, or a "productive" Block Type. For Block Types: Productive Block Time counts towards scheduled hours and is considered productive. Unproductive Block Time counts towards scheduled hours and is considered time that the employee could have been productive, but wasn't. Non-Productive Block Time is subtracted from the total number of hours that the employee could have been productive (i.e., subtracted from scheduled hours).
- Productivity %: Percentage of productive time for the employee. (Hours Productive / Hours Incl. in Productivity) x 100
- Scheduled Hours: Number of hours the employee was scheduled to work.
- Actual Hours: The actual number of hours the employee worked. If clock-ins/outs were not required on the Work Activity, this value is based on the Scheduled hours, unless actuals exist, in which case actual clock ins/outs will be used over scheduled hours. If clock-ins/outs were required on the Work Activity, this calculation looks only at the time clock for actuals.
- Avg. Hours Per Week: Average number of hours worked per week by the employee. (Total Hours / Weeks Analyzed)
- Total Productive Block Time: The total number of the employee's productive block hours. Only blocks that have Productive Block Time enabled in the Block Type definition are included in this calculation.
- Total Non-Productive Block Time: The total number of the employee's non-productive block hours. Only blocks that have Non-Productive Block Time enabled in the Block Type definition are included in this calculation.
- Total Unproductive Block Time: The total number of unproductive block hours. Only blocks that have Unproductive Block Time enabled in the Block Type definition are included in this calculation.
- Missed Opportunities: Number of missed opportunities associated with the employee.
- Cancellations (Qty/$ Fee Collected): Number of employee's appointments that were canceled and the total amount of Cancellation Fees collected.
- No Shows (Qty/$ Fee Collected): Number of no-show appointments for that employee and the total amount of No-Show Fees.
Sales & Client Statistics Client BreakdownSales & Client Statistics Client Breakdown
- Unique Clients Purchasing Services Only: Unique clients who only purchased services in the date range.
- Unique Clients Purchasing Retail Only: Unique clients who only purchased retail in the date range.
- Unique Clients Purchasing Service & Retail: Unique clients who purchased both service and retail in the date range.
- Total Clients: (Unique Clients Purchasing Services Only + Unique Clients Purchasing Retail Only + Unique Clients Purchasing Service & Retail)
- Unique New Clients: A new client is someone new to the business who had a visit during the date range or pool month, with no visits prior to the date range. This metric does not consider fees (Swap Upgrade, Cancellation, No-Show) or Anonymous Clients.
- Unique Repeat Clients: In this report, a repeat client is someone who had a visit during the date range and at least one visit prior to the date range, or a New Client who had another visit on a different day in the date range. This metric does not consider fees (Swap Upgrade, Cancellation, No-Show) or Anonymous Clients.
- Avg. Serv. Clients Per Day: This metric does not consider fees (Swap Upgrade, Cancellation, No-Show). Calculations are:
- Overall Page: (Client Service Visits / # of days in date range where a service was sold)
- Employee Page: (Client Service Visits / # of days in date range where the employee was the servicing employee for a service that was sold)
- Total Services: Total service sales credited to the employee, including Swap Upgrade Fees. Taxes are not included. Refunds are deducted from totals.
Note: Any Swap Upgrade Fee used to pay for a service, add-on, or cancel/no-show fee will count towards Total Services. Otherwise, cancellation and no-show fees are not included.
- Total Services Sold: The total number of services that the employee is credited with selling (accounting for service splits), including Swap Upgrade Fees. Refunds are deducted from totals.
- Service Tickets: The total number of tickets that contain a service that the employee was credited with performing.
- Total Client Service Visits: Number of times that clients came in for service visits. A client who visits multiple times within the date range will have each visit count. This differs from the Service Tickets field in that multiple clients can appear on one ticket. So, a Service Ticket with three clients on it will count as one ticket and three individual client service visits. This metric does not consider fees (Swap Upgrade, Cancellation, No-Show).
- Avg. Service per Service Visit: For a service to count towards this metric, it must have Include in Average Ticket Calculations enabled on the service definition.
(Total Services / Total Client Service Visits) - Avg. Service Units per Service Visit: For a service to count towards this metric, it must have Include in Average Ticket Calculations enabled on the service definition.
(Total Services Sold / Total Client Service Visits) - Avg. Service Units - All Clients: For a service to count towards this metric, it must have Include in Average Ticket Calculations enabled on the service definition.
(Total Services Sold / Total Clients) - Avg. Service per Week: For a service to count towards this metric, it must have Include in Average Ticket Calculations enabled on the service definition.
(Total Services / Weeks Analyzed) - Avg. Service per Hour: For a service to count towards this metric, it must have Include in Average Ticket Calculations enabled on the service definition.
(Total Service Sale Amount / Hours Incl. in Productivity) - Avg. Service Ticket: For a service to count towards this metric, it must have Include in Average Ticket Calculations enabled on the service definition.
(Total Services / Service Tickets) - Avg. Service - All Tickets: To be considered in these calculations, a service must have Include in average ticket calculations enabled on the service definition.
(Total Services Sold / Total Tickets) - Total Liability Sales: Total liability sales for the employee, including packages and gift cards. Refunds are considered in these numbers (that is, refunds are deducted from the total).
- Total Retail: Total revenue from retail sales credited to the employee, accounting for refunds and taxes.
- Total Retail Items Sold: The total number of retail items that the employee is credited with selling.
- Retail Tickets: The total number of tickets that contain a retail item that the employee was credited with selling.
- Total Client Retail Visits: Number of times that clients came in to purchase retail. A client who visits multiple times within the date range will have each visit count.
- Avg. Retail per Retail Visit: (Total Retail / Total Client Retail Visits)
- Avg. Retail Units per Retail Visit: (Total Retail / Total Client Retail Visit)
- Avg. Retail Units - All Clients: (Total Retail Items Sold / Total Clients)
- Avg. Retail per Week: (Total Retail / Weeks Analyzed)
- Avg. Retail per Hour: (Total Retail / Hours Analyzed)
- Avg. Retail Ticket: (Total Retail / Retail Tickets)
- Avg. Retail - All Tickets: (Total Retail / Total Tickets)
- Avg. Ticket (Service & Retail): (Total Services + Total Retail) / Total Tickets
- Avg. Retail per Service Ticket: (Total Retail Sold on Service Tickets) / (The Number of Tickets in Which a Service Was Sold)
Refunds are deducted from totals. The same employee needs to be credited with both the retail and service sale to be counted in this metric. - Average Retail per Service Client: (Total Retail sold on Service Tickets) / (Total Number of Unique Clients who Purchased a Service)
Refunds are deducted from retail total. The same employee needs to be credited with both the retail and service sale to be counted in this metric. - Avg. Retail Units per Service Ticket: (Total Number of Retail Items Sold on Service Tickets / Number of Tickets that have a Service Sold on Them)
Refunds are not considered in this metric. The same employee needs to be credited with both the retail and service sale to be counted in this metric. - Average Retail Units per Service Client: (Total Number of Retail Items Sold on Service Tickets / Number of Unique Clients Who Purchased a Service)
Refunds are not considered in this metric. The same employee needs to be credited with both the retail and service sale to be counted in this metric. - Percentage of Clients Buying Retail: (Unique Clients Who Purchased Retail + Unique Clients who Purchased Retail and Services) / (Total Clients) x 100
- Percentage of Retail to Service: (Total Retail / Total Services) x 100
- Percentage of Retail to Total Sales: (Total Retail / [Total Retail + Total Services]) x 100
Ticket BreakdownTicket Breakdown
- Service Only: Tickets that only had services on them.
- Retail Only: Tickets that only had retail items on them.
- Both Service and Retail: Tickets that had both services and retail items on them.
- Total: Total number of tickets in the date range (Service Only + Retail Only + Both Service and Retail)
Frequency of Visit & RebookingFrequency of Visit & Rebooking
Note: Transient clients are never included in retention or rebooking calculations.
- Request Rate Percentage: Percentage of checked-out appointments that were flagged as requested.
(Number of checked-out requested appointments in date range / Number of total appointments in date range) x 100 - Avg. Frequency of Visit: Only clients who have 2 or more visits during the date range are considered in this metric. The Summary Page bases FOV on visits to the business while the Employee Pages base FOV on visits to the employee. This metric is calculated as: (Number of client visits in date range / Number of unique clients)
- Core Clients: Your Core Client count according to what was selected in the Core Clients option in report setup. The Summary Page bases a visit on new/repeat to the business while the Employee Pages base visits on new/repeat to the employee.
- % of appointments checked out that were Rebooked: Of the clients who came in during the date range and were checked out (rung up), this is the percentage of those clients whose rung up appointment was considered a rebook.
- Clients Rebooked: Of the clients who came in during the date range and were checked out/rung up, this is the number of those clients who rebooked a future appointment.
- Rebook Percentage: Of the clients who came in during the date range and were checked out (rung up), this is the percentage of those clients who rebooked a future appointment. This is a percent value of the Client Rebooked field.
Note: Transient clients are never included in retention or rebooking calculations.
At the top of the Retention section are two tables detailing retention: one table for New Clients, and another table for Repeat Clients. There are business-level tables on the Summary page (if selected), and detailed employee-specific tables on each employee's page.
A client can only count once towards either Request or Non-Request. In the event that both are true in a date range, the client will be reported on under Request data. Clients count once per pool month, and can be either Request OR Non-Request for a given pool month.
Summary Page
- Request row: Clients who had a "requested" appointment in the pool month.
- On the Employee page: Clients who had a "requested" appointment with that employee in the pool month.
- Non-Request row: Clients who had a visit during the pool month but who did not have a "requested" appointment in the pool month.
- On the Employee page: Clients who had a visit during the pool month but did not have a "requested" appointment with that employee in the pool month.
- Clients column: The count of applicable clients (based on the row) in the pool month.
- Retained by Business: This is the overall retention % for your business, calculated as:
(Count of applicable clients per pool month that had a return visit / Count of applicable clients per pool month) x 100
Employee Page
- Request row: Clients who had a "requested" appointment with that employee in the pool month.
(Count of applicable clients per pool month that had a return / Count of applicable clients per pool month) x 100 - Non-Request row: Clients who had a visit during the pool month but did not have a "requested" appointment with that employee in the pool month.
- Clients column: The count of applicable clients (based on the row) in the pool month.
- Retained by Employee Request column: (Count of applicable clients per pool month who requested this employee for their return visit / Count of applicable clients per pool month) x 100
- Retained by Employee Non-Request column: (Count of applicable clients per pool month who had a return visit but who did not request this employee for their return visit / Count of applicable clients per pool month) x 100
- Retained by Business: This is the overall retention % for your business, calculated as:
(Count of applicable clients per pool month that had a return visit / Count of applicable clients per pool month) x 100
Setting up the MA200 report
- Type MA200 in the Convobar, or go to Meevo > Reports > Analytical, and then select the MA200 report.
- Select a date or date range for running the report:
- To run a report for a specific date range, select Custom and specify the Start Date and End Date for the report.
- Otherwise, select a predefined date or range (Yesterday, This Week, Last Week, etc.).
Note: If you select a predefined range (a date other than Custom), you can still change the Start Date and End Date. Doing so automatically changes the date range to Custom.
- Display Summary Page for Selected: Displays a single summary page roll-up of all selected employees within the date range. This option takes effect only if the report is being run for more than one employee.
- Months to look for a return visit: Determines how many months forward the report will look for return visits (after looking back 4 months).
- Core Clients are considered to have __ or more service visits within the date range: A core client is a client who came in for at least this number of service visits in the date range. Use this metric as a custom benchmark to see how many clients came in for multi-service visits during the range. This option does not affect any other metrics; it is a standalone data point.
- Calculate Productive Time Based On: Determines where the report will look for service timings in the Hours and Productivity section. If you select Appointment Specific Time and you have services that were rung up in the register but were never on the Appointment Book, this report looks at Employee Specific Timing first. If none exists, this report looks at the Default Service Timing for those services.
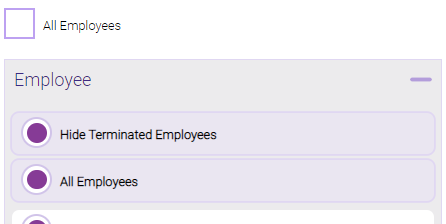
-
All Employees: Enable this checkbox to run the report for all employees within the date range. This includes active, inactive (including terminated), and deleted employees. Or, to run the report for specific employees, deselect the checkbox and use the drop-down to select employees or Employee Categories. You can show or hide inactive employees in this list, but deleted employees will never appear here. Note the All Employees "bubble" in the Employee list selects all employees in that list; it is not the equivalent of selecting the All Employees checkbox.
Note: Selecting All Employees will also return any data tied to the House employee.
Running the report
- When you are ready to generate the report, select a Report Format beside the Run Report button.

- Here is a rundown of each format type:
- PDF: Each time you select Run Report with PDF selected, Meevo opens a separate browser tab that displays the PDF'ed report. Meevo remains on the setup page, so you can quickly jump back over to Meevo to run more date ranges or other reports. Each PDF report you run will open its own browser tab, so you can easily review and compare reports by simply jumping between browser tabs.
Note for viewing on iOS: If viewing a PDF on a mobile device running iOS, swipe from left to right on the screen to return to Meevo. - HTML: This is our original legacy format, which opens the report within Meevo. All of the functionality within that report is still there and available via the toolbar.

- XLSX: Each time you select Run Report, your browser auto-downloads the report in .xlsx format. Select the downloaded file in the browser footer to open the spreadsheet.
- PDF: Each time you select Run Report with PDF selected, Meevo opens a separate browser tab that displays the PDF'ed report. Meevo remains on the setup page, so you can quickly jump back over to Meevo to run more date ranges or other reports. Each PDF report you run will open its own browser tab, so you can easily review and compare reports by simply jumping between browser tabs.
- Select Run Report to generate the report in your chosen format. Depending on the type of report and criteria you entered, this process may take a few minutes.