MR130: Sales by Month
The MR130 displays Service and Product sales and averages, broken down by each day of the selected month or by each month of the selected year. Details include counts for unique clients, service visits, tickets, services and retail purchased, and much more.
Tip: Run the MR130 monthly to analyze your employees' performance, comparing sales for specific months with sales totals from previous years. This comparison can help determine if high or low sales for a given month are an isolated occurrence or an historical trend.
What is the difference between a "visit" and a "unique client?"
This report follows our usual standard for what constitutes a visit: a visit occurs when a client is rung up for at least one service on a transaction. It is not necessary for the service to have been booked before it was rung up.
A unique client is just an individual who only counts once towards the Unique client metric, regardless of how many visits they have. So if Matt visits a location 4 times in the date range, he will count as 1 unique client and 4 visits.
Report definitions
The columns that appear in the MR130 are identical regardless of the mode. For all sale numbers, refunds are included (refund amounts are subtracted from the total).
- # Unique Clients Buying Servs.: The number of unique clients who purchased services.
- # Serv. Visits: The number of times clients came in for service visits.
- If a client has multiple visits on one ticket, it counts as one visit.
- If a client is listed on multiple tickets in a day where they received at least one service, then each ticket counts as one visit.
- Unique clients on a ticket who received a service will each count as a visit.
- [Service Category]: Sales for the Service Category that was selected during report setup.
- Total Service (Including [Service Category]): The total of all service sales.
- Avg. Serv. $ Per Client: (Total Service Incl. Service Category / # of Unique Clients Buying Servs.)
- Avg. Serv. $ Per Visit: (Total Service Incl. Service Category / # of Serv. Visits)
- Retail Items Sold: The number of retail items sold.
- Retail Only Tix: The number of tickets where only retail items were sold.
- Total Retail (Not Incl. [Product Category]): The total amount of retail sales, not including the Product Category selected during report setup.
- [Product Category]: Sales for the Product Category that was selected during report setup.
- Total Retail (Incl. [Product Category]): (Total Retail Not Incl. Product Category + Product Category)
- Avg. Retail $ Per Serv. Visit: (Total Retail / # of Serv. Visits)
- Avg. Unit Per Serv. Visit: (Retail Items Sold / # of Serv. Visits)
- Total Sales: (Total Service Incl. Service Category + Total Retail Incl. Product Category)
- Product Bundle Sales: Total sales for all product bundles.
- Total Tix: The total number of tickets.
- Emps with Serv. Sales: The number of unique employees who were credited with a service sale.
- Serv. Client to Emp. Ratio: (# Unique Clients Buying Services / Emps with Serv. Sales)
Totals row: Rows in each column are added up to give totals, with the exception of these rows. The Totals section is inclusive of sales activity from the current day/month.
- # Unique Clients Buying Servs.: The number of unique clients that have bought services across the entire report. A client will only count once in this metric.
- Avg Serv. $ Per Client: (Total row's Total Service Incl. Service Category / Total row's # Unique Clients Buying Servs.)
- Avg. Serv. $ Per Visit: (Total row's Total Service Incl. Service Category / Total row's # Serv. Visits)
- Avg. Retail $ Per Serv. Visit: (Total row's Total Retail Incl. Product Category / Total row's # Serv. Visits)
- Avg. Unit Per Serv. Visit: (Total row's Retail Items Sold / Total row's # Serv. Visits)
- Emps with Serv. Sales: The number of unique employees that were credited with a service sale across the entire report.
- Serv. Client to Emp Ratio: (Total row's # Unique Clients Buying Servs. / Total row's Emps with Serv. Sales)
Averages row: A standard "average" calculation is used for each column, with the exception of the columns below. Note averages account for sales activity from completed days/months only. Sales activity from the current day/month is not included in calculations of averages.
-
Avg Serv. $ Per Client: (Average row's Average Service Incl. Service Category / Average row's # Unique Clients Buying Servs.)
- Avg. Serv. $ Per Visit: (Average row's Total Service Incl. Service Category / Average row's # Serv. Visits)
- Avg. Retail $ Per Serv. Visit: (Average row's Total Retail Incl. Product Category / Average row's # Serv. Visits)
- Avg. Unit Per Serv. Visit: (Average row's Retail Items Sold / Average row's # Serv. Visits)
- Serv. Client to Emp Ratio: (Average row's # Unique Clients Buying Servs. / Average row's Emps with Serv. Sales)
Setting up the MR130 report
- Type MR130 in the Convobar, or go to Meevo > Reports > Register/Sales, and then select the MR130 report.
- Select a report mode:
- Monthly Breakdown by Day: In this mode, you'll select a month, and the MR130 will display sales for each day.
- Yearly Breakdown by Month: In this mode, you'll select a year, and the MR130 will display sales for each month.
- Select a month or year (depending on your selection above) for running this report.
- Select a Service/Product Category to highlight: Run the report for an individual service and product category by picking one of each.
-
All Employees: Enable this checkbox to run the report for all employees within the date range. This includes active, inactive (including terminated), and deleted employees. Or, to run the report for specific employees, deselect the checkbox and use the drop-down to select employees or Employee Categories. You can show or hide inactive employees in this list, but deleted employees will never appear here. Note the All Employees "bubble" in the Employee list selects all employees in that list; it is not the equivalent of selecting the All Employees checkbox.
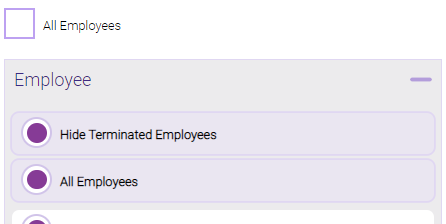
Note: Selecting All Employees will also return any data tied to the House employee.
Running the report
- When you are ready to generate the report, select a Report Format beside the Run Report button.

- Here is a rundown of each format type:
- PDF: Each time you select Run Report with PDF selected, Meevo opens a separate browser tab that displays the PDF'ed report. Meevo remains on the setup page, so you can quickly jump back over to Meevo to run more date ranges or other reports. Each PDF report you run will open its own browser tab, so you can easily review and compare reports by simply jumping between browser tabs.
Note for viewing on iOS: If viewing a PDF on a mobile device running iOS, swipe from left to right on the screen to return to Meevo. - HTML: This is our original legacy format, which opens the report within Meevo. All of the functionality within that report is still there and available via the toolbar.

- XLSX: Each time you select Run Report, your browser auto-downloads the report in .xlsx format. Select the downloaded file in the browser footer to open the spreadsheet.
- PDF: Each time you select Run Report with PDF selected, Meevo opens a separate browser tab that displays the PDF'ed report. Meevo remains on the setup page, so you can quickly jump back over to Meevo to run more date ranges or other reports. Each PDF report you run will open its own browser tab, so you can easily review and compare reports by simply jumping between browser tabs.
- Select Run Report to generate the report in your chosen format. Depending on the type of report and criteria you entered, this process may take a few minutes.