MA240: Lifetime Client Value
The MA240 uses sales data from the last 12 months to project clients' lifetime value to your business over the next 10 years. It also projects future sales based on price increases and additional visits per year, per client. You can run this report for Members, Non-Members, or Both.
The MA240 demonstrates how better frequency of visit (FOV) and small pricing increases can drastically improve a client's value.
Note: If data does not go back 12 months, the report will use the existing data to project metrics for the year.
What is a "visit?"
The definition of a visit in the MA240 is a client who has either a service or retail transaction. This is different from our usual standard, which only considers service transactions when counting visits. To get a complete idea of a client's true lifetime value, we must also consider their retail-only purchases.
What is the difference between a "unique client" and a "visit?"
A unique client is just an individual who only counts once towards the Unique client metric, regardless of how many visits they have. If Matt visits a location 4 times in the date range, he will count as 1 unique client and 4 visits.
Report definitions
Summary Box
The summary box at the top of the report displays metrics for all clients compared with metrics for clients who have a certain number of visits or more; the number of visits is determined by the report setup option Analyze clients with __ or more service visits in Date Range.
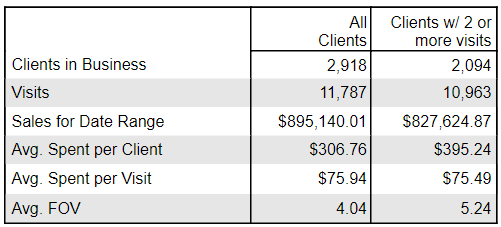
- Clients in Business: The number of unique clients who had a visit over the past 12 months.
- Visits: The number of visits (service or retail transactions) by the clients analyzed in the date range. A client can count more than once during the date range.
- Sales for Date Range: Total service and retail sales over the past 12 months, with refunds accounted for.
- Avg. Spent per Client: (Sales for Date Range / Clients in Business)
- Avg. Spent per Visit: (Sales for Date Range / Visits)
- Avg. FOV: (Visits / Clients)
Projection Table
In the projection table, the options you configured during report setup are used to calculate projections for Avg. Spent per Client and Lifetime Value per Client over the next 10 years.
Note that for Year 1 in the projection table, the Avg. Spent per Client and Lifetime Value per Client will always be the Avg. Spent per Client for Clients w/ x or more visits.
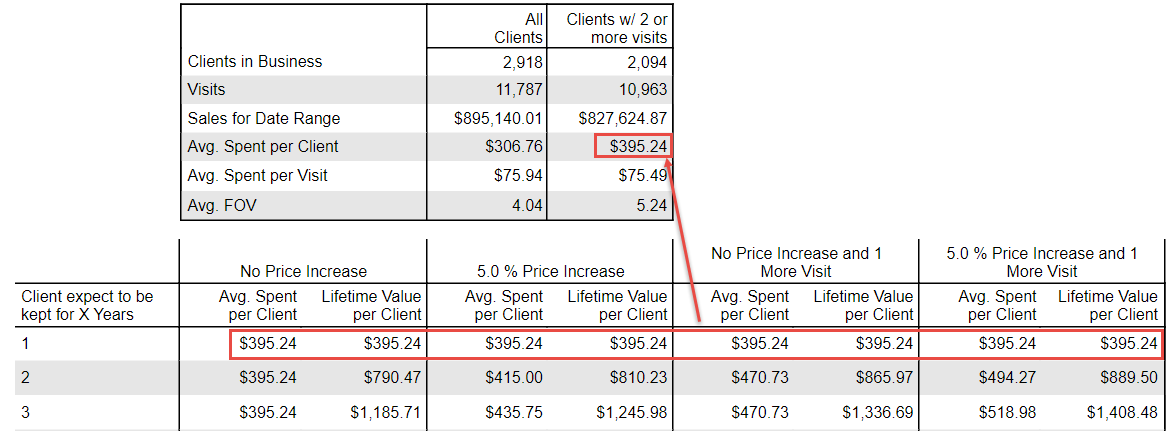
Read on for details on calculations for Years 2 and greater.
No Price Increase column
This column predicts values if there are no changes to prices or the number of client visits per year.
- Avg. Spent per Client: For Years 2 and greater, the Avg. Spent per Client is always the same. This is because with no changes to pricing or number of visits per year, the average spending of your clients is not predicted to change.
- Lifetime Value per Client: For Years 2 and greater, the Lifetime Value per Client will always be:
(That Year's Avg. Spent per Client + Previous Year's Lifetime Value per Client)
In the example below, to calculate Year 2's Lifetime Value per Client in this column, we add Year 2's Avg. Spent per Client and the previous year's Lifetime Value per Client.
(395.24 + 395.24) = ~790.47

__% Price Increase column
This column predicts values if you raise prices by a certain percent each year.
- Avg. Spent per Client: For Years 2 and greater, the Avg. Spent per Client is calculated as:
(Previous Year's Avg. Spent per Client) x (% Price Increase x 100)
In the example below, to calculate Year 2's Avg. Spent per Client in this column, we take into account a 5% increase:
(395.24 x 1.05) = 415.00

- Lifetime Value per Client: For Years 2 and greater, the Lifetime Value per Client will always be:
(That Year's Avg. Spent per Client + Previous Year's Lifetime Value per Client)
See above for the example of this field being calculated.
No Price Increase and __ More visits column
This column predicts values if you don't raise prices, but do get clients to come in for more visits. The extra visits are not compounded per year; the visit is only calculated for Year 2, as it is not realistic to predict that client visits will continually go up by a certain number per year.
- Avg. Spent per Client: For Years 2 and greater, the Avg. Spent per Client is calculated as:
(Avg. Spent per Client + Avg. Spent per Visit)

In this example, to calculate Year 2's Avg. Spent per Client in this column, we add the Avg. Spent per Client with the Avg. Spent per Visit:
395.24 + 75.49 = 470.73
This will be the value in every row from Year 2 to Year 10 because with no changes to pricing and only one extra visit, the average spending of your clients is predicted to go up only by the value of the Avg. Spent per Visit (in this example, 1 visit, or 75.49).

- Lifetime Value per Client: For Years 2 and greater, the Lifetime Value per Client will always be:
(That Year's Avg. Spent per Client + Previous Year's Lifetime Value per Client)
See above for the example of this field being calculated.
__% Price Increase and __ More Visits column
This column predicts values if you raise prices and get clients to come in for more visits, and demonstrates how you can use this combination to steadily increase revenue each year. The extra visits are not compounded per year; the visit is only calculated for Year 2, as it is not realistic to predict that client visits will continually go up by a certain number per year.
- Avg. Spent per Client: For Year 2, the Avg. Spent per Client is calculated as:
(Year 1 Avg. Spent per Client + Avg. Spent per Visit) x (% Price Increase x 100)
In the example below, the Avg. Spent per Client for Year 2 is calculated as:
(395.24 + 75.49) x 1.05 = 494.27

For Year 3 to Year 10, we simply multiply the previous year's Avg. Spent per Client by the % increase:
(Previous Year's Avg. Spent per Client) x (% Price Increase x 100)
In the example below, the Avg. Spent per Client for Year 3 is calculated as:
494.27 x 1.05 = 518.98

- Lifetime Value per Client: For Years 2 and greater, the Lifetime Value per Client will always be:
(That Year's Avg. Spent per Client + Previous Year's Lifetime Value per Client)
See above for the example of this field being calculated.
To run the MA240 report
- Type MA240 in the Convobar, or go to Meevo > Reports > Analytical, and then select the MA240 report.
- Analyze clients with __ or more service visits in Date Range: Clients who have this many service visits over the past 12 months will be included in the report.
- and are __: This option appears if at least one membership is available at the location.
- Members: Only clients who have a valid membership (one that is not terminated) will appear in the report.
- Non-Members: Only clients who do not have a valid membership will appear in the report.
- Both Members & Non-Members: Both types of clients will appear in the report.
- Use __ for year-over-year price increase projections: The percentage you enter here will be used to calculate Avg. Spent per Client projections and Lifetime Value per Client projections.
- Project sales if clients had __ more visits in date range: The report will use this number to project the Avg. Spent per Client and Lifetime Value per Client if the client had this many more visits over the course of the year.
Running the report
- When you are ready to generate the report, select a Report Format beside the Run Report button.

- Here is a rundown of each format type:
- PDF: Each time you select Run Report with PDF selected, Meevo opens a separate browser tab that displays the PDF'ed report. Meevo remains on the setup page, so you can quickly jump back over to Meevo to run more date ranges or other reports. Each PDF report you run will open its own browser tab, so you can easily review and compare reports by simply jumping between browser tabs.
Note for viewing on iOS: If viewing a PDF on a mobile device running iOS, swipe from left to right on the screen to return to Meevo. - HTML: This is our original legacy format, which opens the report within Meevo. All of the functionality within that report is still there and available via the toolbar.

- XLSX: Each time you select Run Report, your browser auto-downloads the report in .xlsx format. Select the downloaded file in the browser footer to open the spreadsheet.
- PDF: Each time you select Run Report with PDF selected, Meevo opens a separate browser tab that displays the PDF'ed report. Meevo remains on the setup page, so you can quickly jump back over to Meevo to run more date ranges or other reports. Each PDF report you run will open its own browser tab, so you can easily review and compare reports by simply jumping between browser tabs.
- Select Run Report to generate the report in your chosen format. Depending on the type of report and criteria you entered, this process may take a few minutes.